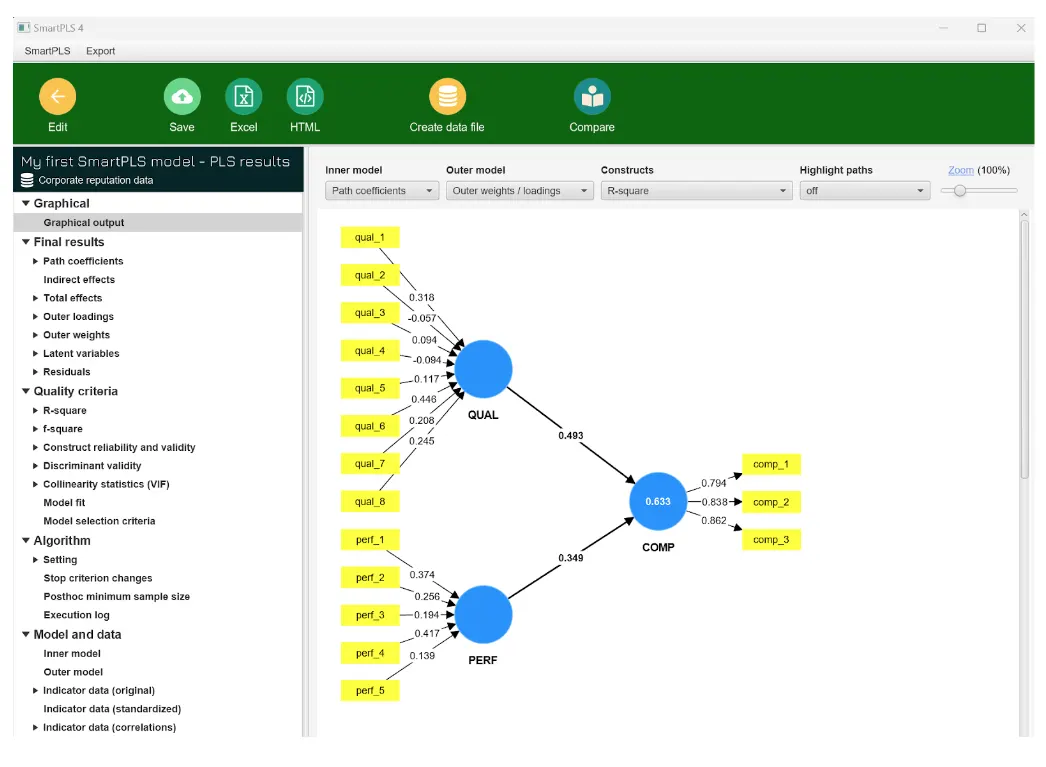
Partial Least Squares Structural Equation Modeling (PLS-SEM)
PLS-SEM is particularly useful when dealing with complex models, small sample sizes, or non-normally distributed data, making SmartPLS a go-to choice for researchers in various fields, including social sciences, business, and marketing.